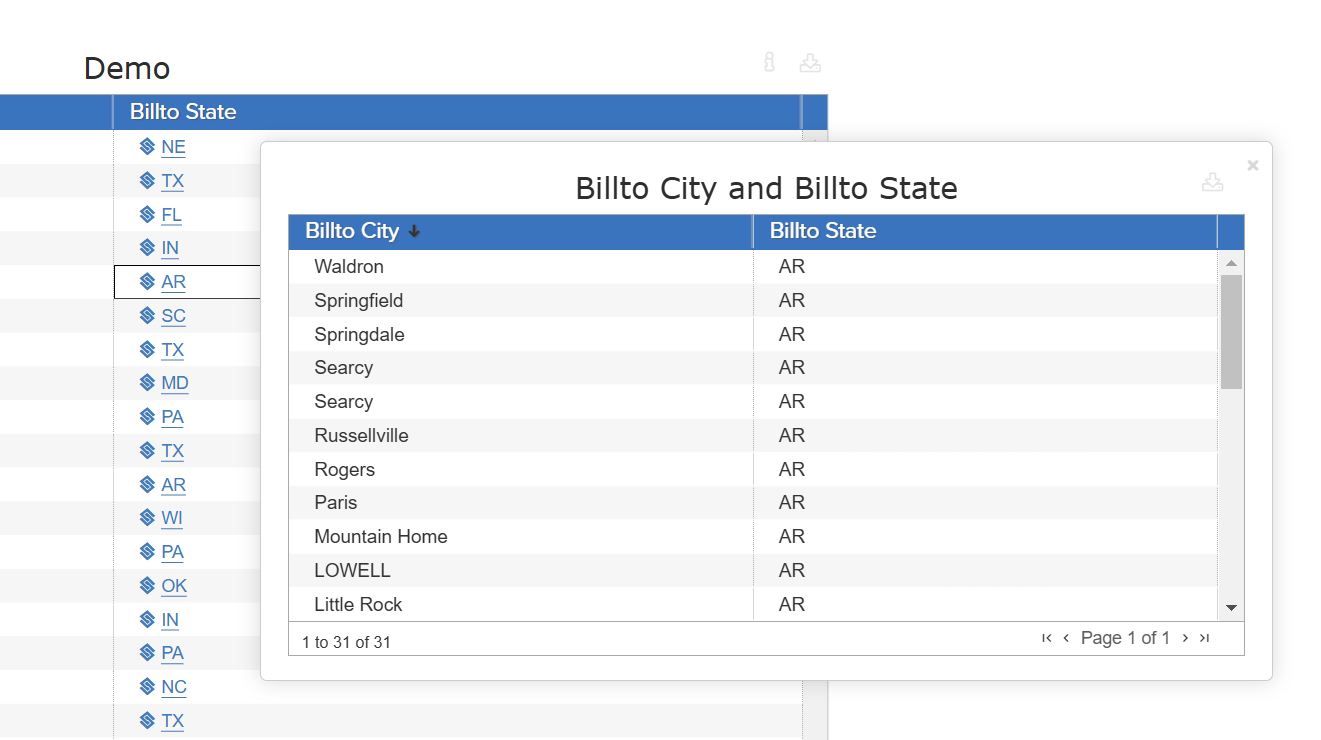
Popup links can be used to display unique results depending on the specific record a user selects in a raw/grouped table.
For example, in the image below, a user is attempting to view specific cities, depending on the state selected:
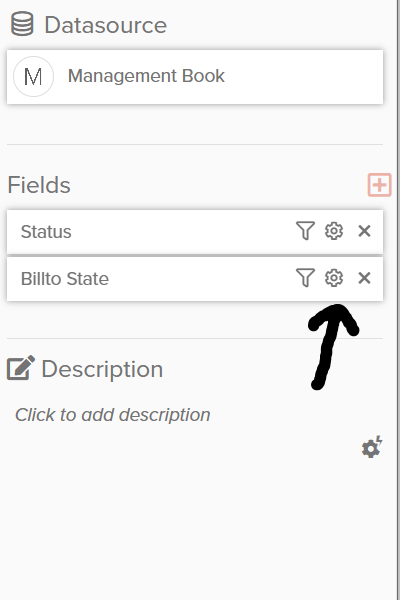
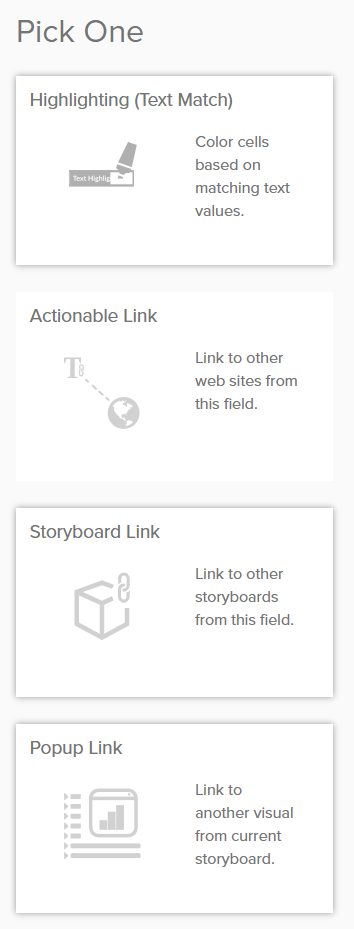
After adding a visual, hover over the newly-added visual and click the gear icon for a specified measure or group-by field.
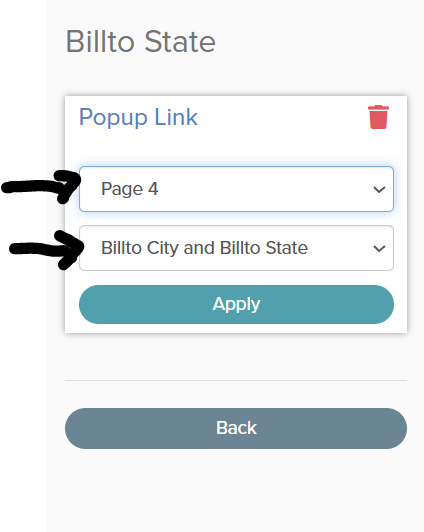
Next, specify the target popup visual within the Storyboard. Make sure to specify the correct visual name (this visual must be made before you can select it from drop-down):